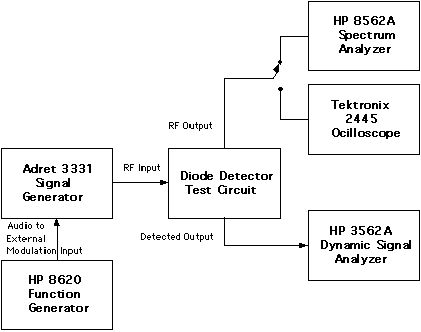
Figure 2 - Test Equipment Configuration
Elementary Analysis of Distortion in Diode
Detection of Amplitude Modulation
Introduction
This analysis considers the distortion produced
by diode detection of amplitude modulation. A typical detector consisting
of series diode followed by a simple RC lowpass filter is analyzed.
Theoretical Analysis
The diode characteristic is given by the Shockley equation:
(1) Id = Irss[e
(Vd/2VT)]
The exponential power series is given by:
(2) ex = 1 + x + x2/2!
+ x3/3! = x4/4!
+ ........ + xn/n!
where, in the case of a diode, x= Vd/2VT
and VT ~
26 mV at 300 deg K for a silicon diode.
Examining the x2 component of Eq. 2,
for the diode detector:
Let wc be the carrier frequency, wm be the modulating frequency, w1
be the upper sideband (wc + wm),
and w2 be the lower sideband (wc
- wm).
The input to the diode is given by:
(3) cos wct + m/2(cos
w1t + cos w2t),
an AM signal where m is the modulation index.
The diode output is given by:
(4) d(t) = [phi(t)]2 = [cos wct
+ m/2(cos w1t + cos
w2t)]2
Expanding and simplifying:
(5) d(t) = cos2 wct
+ m/2(cos wct * cos
w1t + cos wct
* cos w2t + cos wct
* cos w1t + cos wct
* cos w2t) + m2/4(cos2 w1t + cos2 w2t + cos w1t * cos w2t
+ cos w1t * cos w2t)
(6) d(t) = cos2 wct
+ m(cos wct * cos w1t
+ cos wct * cos w2t)
+ m2/4(cos2
w1t + cos2
w2t) + m2/2(cos
w1t * cos w2t)
(7) d(t) = cos2 wct
+ m/2[cos(wc + w1)t
+ cos(wc - w1)t
+ cos(wc + w2)t
+ cos(wc - w2)t]
+ m2/8 (2 + cos 2w1t
+ cos 2w2t) + m2/2[cos(w1 + w2)t + cos(w1 - w2)t]
(8) d(t) = cos2 wct
+ m/2[cos((wc + (wc
+ wm))t + cos((wc
- (wc + wm))t
+ cos((wc + (wc
- wm))t + cos((wc
- (wc - wm))t]
+ m2/8 [2 + cos (2wc
+ wm)t + cos (2wc
- wm)t] + m2/2[cos
((wc + wm)
+ (wc - wm))t
+ cos ((wc + wm)
- (wc - wm))t]
(9) d(t) = cos2 wct
+ m/2[cos(2wc + wm)t
+ coswmt + cos(2wc
- wm)t + coswmt]
+ m2/8 [2 + cos (2wc
+ wm)t + cos (2wc
- wm)t] + m2/2[cos2wct + cos2wmt]
The typical diode detector is followed by a lowpass filter (typically an
RC type, that passes only the audio frequencies). Thus, all wc
related terms in Eq. 9 are removed or filtered out giving:
(10) m(t) = m2/4 + m*cos wmt
+ m2/8[cos 2wmt]
Here, the m2/4 is the DC term, the m*cos
wmt term is the desired audio signal, and
the m2/8 term is the distortion term (second
harmonic distortion to be exact). It is clear that the harmonic distortion
will increase as the modulation level increases because the distortion is
increasing as the square of the modulation index, and the fundamental (desired
audio) is increasing linearly with the modulation index. Also, for simplicity’s
sake, the higher order terms (3rd, 4th, 5th, harmonic distortion components)
were not considered. But in actuality, the would contribute to the overall
total harmonic distortion.
Total Harmonic Distortion (THD) expressed as a percentage is given by:
(11) THD (%) = (Ph/Pf)
*100, where Ph is the power in the harmonics,
and Pf is the power in the fundamental.
Thus, the diode detector THD is given by:
(12) THD (%) = (m2/8)2/m2) * 100, or (m2/64)
*100
Calculating the THD for various modulation indices gives:
| Modulation Index (%) |
THD (%) |
| 10 | 0.015625 |
| 20 | 0.0625 |
| 30 | 0.140625 |
| 40 | 0.25 |
| 50 | 0.390625 |
| 60 | 0.5625 |
| 70 | 0.765625 |
| 80 | 1.0 |
| 90 | 1.265625 |
| 100 | 1.5625 |
| 150 | 3.515625 |
| 200 | 6.25 |
The typical diode detector consisting of series diode followed by a simple
RC lowpass filter will produce a distorted output due to the inherent non-linearities
of the diode. The distortion increases exponentially with the modulation
index.
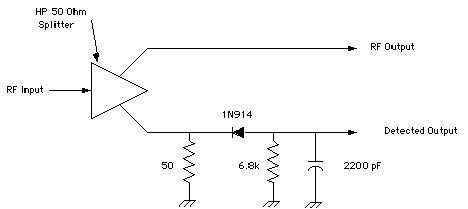
Figure 2 - Test Equipment Configuration
| Modulation Index (%) |
THD (%) |
| 10 | 1.02 |
| 25 | 0.08 |
| 50 | 0.32 |
| 100 | 2.0 |
| 150 | 6.3 |
The THD measurements were made with the HP 3562A Dynamic Signal Analyzer.
The 3562A is a two channel Fast Fourier Transform (FFT) based analyzer.
It has a built in THD measurement function.
The measured THD values in Table 2 track closely with the calculated values
in Table 1. The value for 10 percent modulation appears to be erroneous,
as it is much greater than calculated. Also note that the THD values for
100 and 150 percent modulation are higher than the calculated values. This
could be due to the contribution of the higher order harmonics in the measured
values. These higher order components were not considered in the theoretical
analysis. It is clear, though that distortion increases exponentially with
modulation index or percentage. The distortion becomes problematic at indices
of approaching 100 percent and severe at percentages greater than 100 percent.
Conclusion
Both theoretical and empirical analysis shows that the typical diode detector
consisting of a series diode followed by a simple RC lowpass filter will
produce a distorted output due to the inherent non-linearities of the diode.
The distortion increases exponentially with the modulation index. The amount
of distortion is most significant at modulation indices approaching and
exceeding one.